Prediction Markets vs Polls: Which Predicts Elections Better in 2026?
Prediction markets showed stronger accuracy than traditional polls when forecasting the 2024 U.S. presidential election. They correctly signaled a Trump victory while many poll averages pointed to a near-tie.
The edge comes from financial incentives that reward accurate information over time. With the 2026 midterms approaching, these tools offer voters and analysts a useful way to track shifting probabilities.
What Are Prediction Markets?
Prediction markets let participants buy and sell contracts tied to event outcomes. Prices reflect the crowd's collective view of probabilities. A contract that pays $1 if a candidate wins, for example, trading at 60 cents signals a 60 percent chance.
Platforms bring together traders who have real money at stake. Unlike opinion surveys, these markets update continuously as fresh information arrives. Traders can enter or exit positions at any moment, which creates a dynamic pricing system.
Historical data from the Iowa Electronic Markets, running since 1988, shows these platforms have often beaten polls across multiple cycles. Key mechanics include binary Yes/No shares and multi-outcome markets. Liquidity plays a big role: high-volume markets tend to resist manipulation.
In 2024, Polymarket recorded billions in volume on the presidential race and delivered robust signals.
- Financial accountability drives accuracy because wrong bets cost money.
- Diverse participants bring varied expertise beyond typical poll respondents.
- Continuous trading incorporates breaking news faster than periodic surveys.
Prediction markets cover elections alongside sports, crypto, and news. Skill-focused versions add analytics and AI tools to help users refine forecasts.
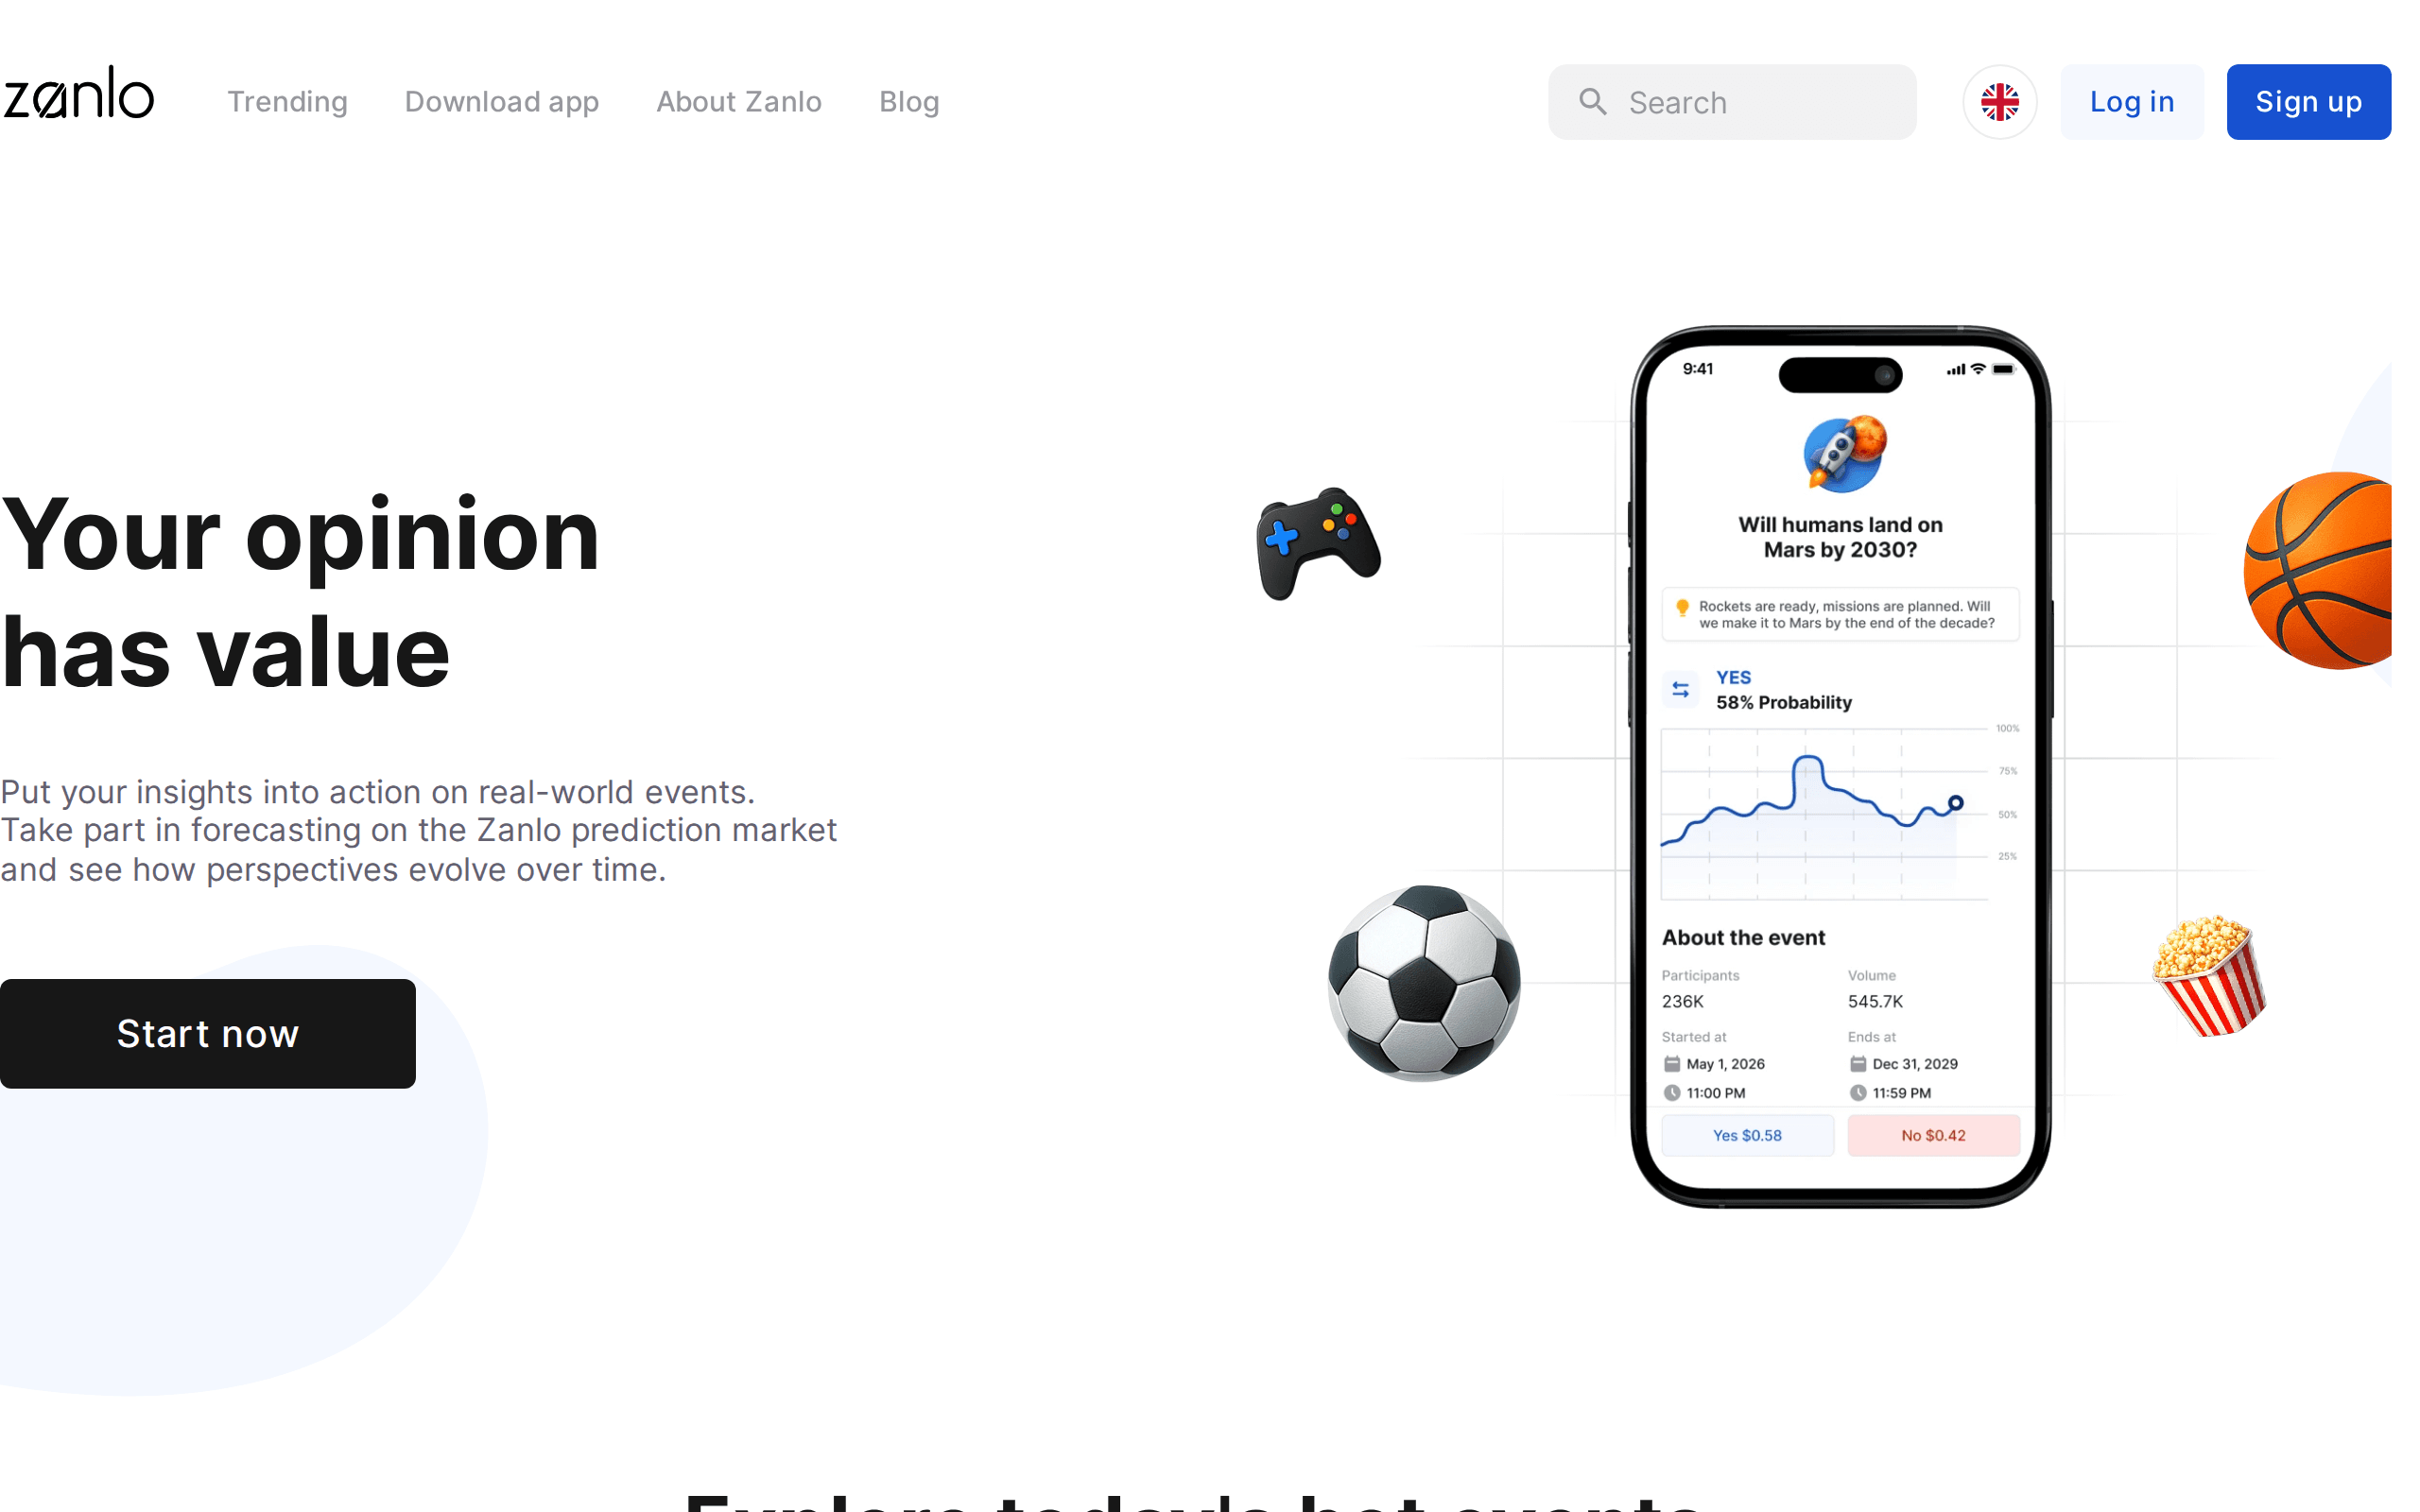
Zanlo stands out here as a skill-based prediction market platform for forecasting real-world outcomes in politics, sports, crypto, and global trends across 18 categories. It includes built-in historical stats, live data, and AI-powered forecasts, giving users full control to enter Yes/No positions and exit before resolution. Personal performance tracking and community features let users follow top predictors, making it ideal for those seeking data-driven engagement with events.
How Traditional Polls Work and Their Limitations
Polls survey representative samples of likely voters on preferences, then aggregate results with margins of error. Organizations like Gallup or academic consortia run them regularly and adjust for demographics and turnout models.
Strengths include detailed breakdowns by age, region, and issues. Weaknesses surface in non-response bias, where certain groups skip surveys, and in rapid shifts in voter sentiment between polls. In 2024, national averages often underestimated Trump support in key states.
Polls measure current opinion well but struggle to project final turnout or late-deciding voters. Sampling challenges have grown with cell phones and declining response rates.
Historical Accuracy Comparison
Research consistently finds prediction markets edging out polls for binary outcomes. The Iowa Electronic Markets beat polls 74 percent of the time from 1988 to 2004 on political candidacies. In 2024, Polymarket prices showed Trump with 58-65 percent odds in the final weeks, aligning with the actual 312-226 Electoral College result, while models from FiveThirtyEight hovered near 50 percent.
A Vanderbilt study and arXiv analysis confirmed Polymarket's superiority for the presidential race and swing states. Accuracy varied, however: some congressional races showed mixed results due to lower volumes. Undark reported that while Polymarket succeeded on the top race, broader comparisons across events leave the overall jury out.
Polls improved in 2024 per AAPOR reviews, narrowing but not eliminating the gap. Prediction markets shine when information flows freely and stakes are high.
Key Factors Influencing Predictive Power
Several elements determine which method performs better:
- Time horizon: Markets adjust faster to news; polls lag by days or weeks.
- Market liquidity: High trading volume reduces noise from outliers.
- Participant incentives: Money at risk filters out casual guesses.
- Event complexity: Simple binary races favor markets; nuanced issues benefit poll demographics.
- External shocks: Both can miss black-swan events, but markets recover quicker.
In low-information environments, polls may hold an advantage. For high-stakes elections with heavy media coverage, markets often prevail.
Case Studies from Recent Elections
The 2024 cycle provided a clear test. Polymarket diverged from poll averages in October, correctly calling Trump's edge amid debate fallout and campaign momentum. Academic papers on SSRN and arXiv documented this outperformance, attributing it to trader accountability.
Earlier cycles, such as 2016 and 2020, showed markets competitive but not always dominant. PredictIt, another established platform, maintained strong records across thousands of markets. For 2026 midterms, similar dynamics are expected, with markets likely to lead on Senate and House control probabilities.
Users benefit from platforms offering exit options before resolution, allowing profit-taking on shifting odds.
How Zanlo Enhances Prediction Markets
Skill-based platforms address common barriers by emphasizing analysis over pure speculation. Zanlo provides real-time data and AI forecasts tailored to each event, helping users build better models. Community tools reveal top performers' strategies, fostering learning.
With risk-free onboarding via bonus funds, newcomers can test approaches across categories without immediate financial pressure. Full position control means traders avoid holding until the end if new evidence emerges. This setup suits those treating forecasting as a skill to develop rather than gambling.
Pros and Cons of Each Approach
Prediction markets pros:
- Real-money incentives promote accuracy.
- Rapid incorporation of information.
- Transparent probability outputs.
Cons:
- Potential for low liquidity or large-bettor influence.
- Regulatory restrictions in some jurisdictions.
- Less demographic insight.
Polls pros:
- Rich voter segmentation data.
- Established methodologies refined over decades.
- Accessibility without financial risk.
Cons:
- Sampling biases and non-response issues.
- Slower updates.
- Difficulty predicting turnout precisely.
Combining both yields the strongest insights for analysts.
Practical Tips for Using These Tools in 2026
Track multiple sources and note divergences. Focus on high-volume markets for reliability. Use platforms with educational features to improve personal accuracy. Monitor volume and open interest as liquidity indicators. For midterms, watch Senate race markets closely as they often resolve earlier than national polls finalize.
Stay aware of regulatory changes affecting platform availability. Historical performance data helps contextualize current odds.
Prediction markets offer a powerful complement to polls, with evidence favoring their edge in outcome prediction for major elections. Platforms emphasizing skill and data, such as Zanlo, make these tools more accessible and educational for ongoing use.